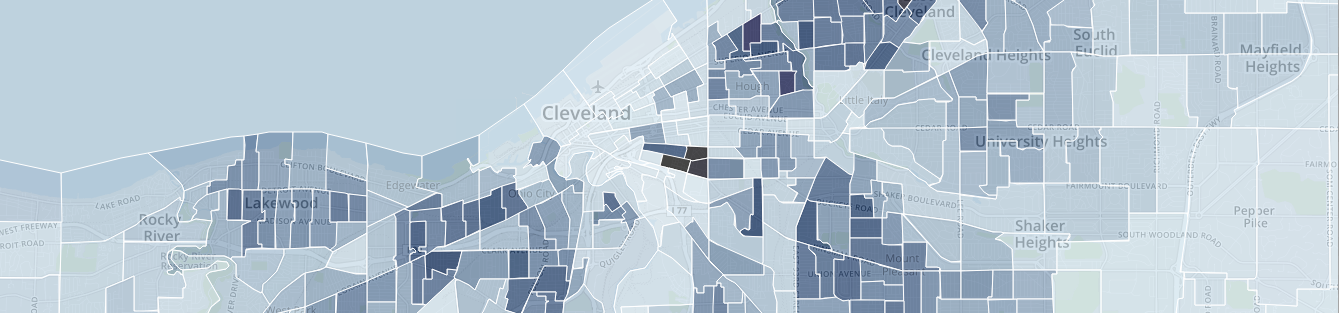

Interactive Cuyahoga County Age Map
October 11, 2014
A while back I decided I wanted to learn how to make a web map, so I did. I was inspired by the New York Times graphics team, as well as D3.js, which was created by Mike Bostock (who makes awesome things). This is small description of what I used, and how I did it. If you want to skip to the end and see what I did, look no farther. If you want to see all the code, check out my GitHub repository for this.
Getting the data
The first thing I did was decided what to map, and given that I am from Cleveland, I decided to look for Census data, which I found through NEOCANDO, a data initiative hosted by Case Western Reserve University which did require signing up for, but contains a lot of searchable census data and exports to .csv files easily, which is nice.
The tract shapefile was found through the US Census website and a bit of digging (it really should be easier to find, I think). I had to convert the data from .csv and .shp to a single .json file, and followed Bostock’s “Let’s make a map!” example for this, which is described more in the repo
This was the easy part, and I was left to go find out how to map all of this. I originally wanted to work in D3.js, and I ended up making a map purely in D3.js for housing age by following Bostock’s tutorial, but decided I wanted some interactivity and a background map and scrapped my D3 map.
Enter Mapbox
And boy was it easier, as I found Mapbox and the Mapbox.js and Leaflet.js libraries, which are built specifically for mapping. In fact, the important code becomes:
$.getJSON("./cuy2.json", function(data) {
    geojson = L.geoJson(data, {
    	style: style,
      	onEachFeature: onEachFeature
    });
    mapboxTiles.addTo(map);
    geojson.addTo(map);
 });
which is using jQuery to load the .json file (more on that soon). A function named “style” colors the tracts by their values, like so:
function style(feature) {
	return {
		weight: 1,
		opacity: 1,
		color: 'white',
		fillOpacity: 0.7,
		fillColor: color(feature.properties[ages[aindex]+"Num"+decades[dindex]]/feature.properties['ALAND00']*2589990)
	};
}
Forget about the index values, also.
By copying from the choropleth examples in the Leaflet.js documentation, I was able to hack together a map that displayed the population densities (or total population) of various age ranges by Census tract throughout the county. But I wanted more!
Enter jQuery
I don’t think I had heard of jQuery before all this – I think I was just confused why some webpages had $’s everywhere, but I learned about it through this. It is, in fact, a javascript library that helps a lot when you are dealing with interactivity, and an important piece of the puzzle as the mapping libraries were limited in this capacity.
Through simple code, like so:
$("#map").keydown(function( event ) {
	console.log(event.which)
	switch (event.which) {
      	case 37: dindex = Math.max(decadeMin, dindex - 1); break;
      	case 39: dindex = Math.min(decadeMax, dindex + 1); break;
      	case 40: aindex = Math.max(ageMin, aindex - 1); break; // down
      	case 38: aindex = Math.min(ageMax, aindex + 1); break; // up
    }
    geojson.setStyle(style)
    title.transition()
        .attr("class", "title")
    	.text("Residents per square mile ages " + ages_text[aindex] + " in " + decades_text[dindex])
});
the arrow keys were mapped to different events, changing the Census decade or age range, thus updating values that are passed into the style function above and then updated in the map, thus getting the basic interactivity I was looking for, all while on top of a custom-colored map through Mapbox.
Mapping victory!
And thus, after much googling and reading documentation, I was able to plot Census data interactively. If you have any questions about the code (or suggestions, since I know there’s better ways of doing certain things), let me know! Again, the final result is here and there’s also the GitHub repository.