
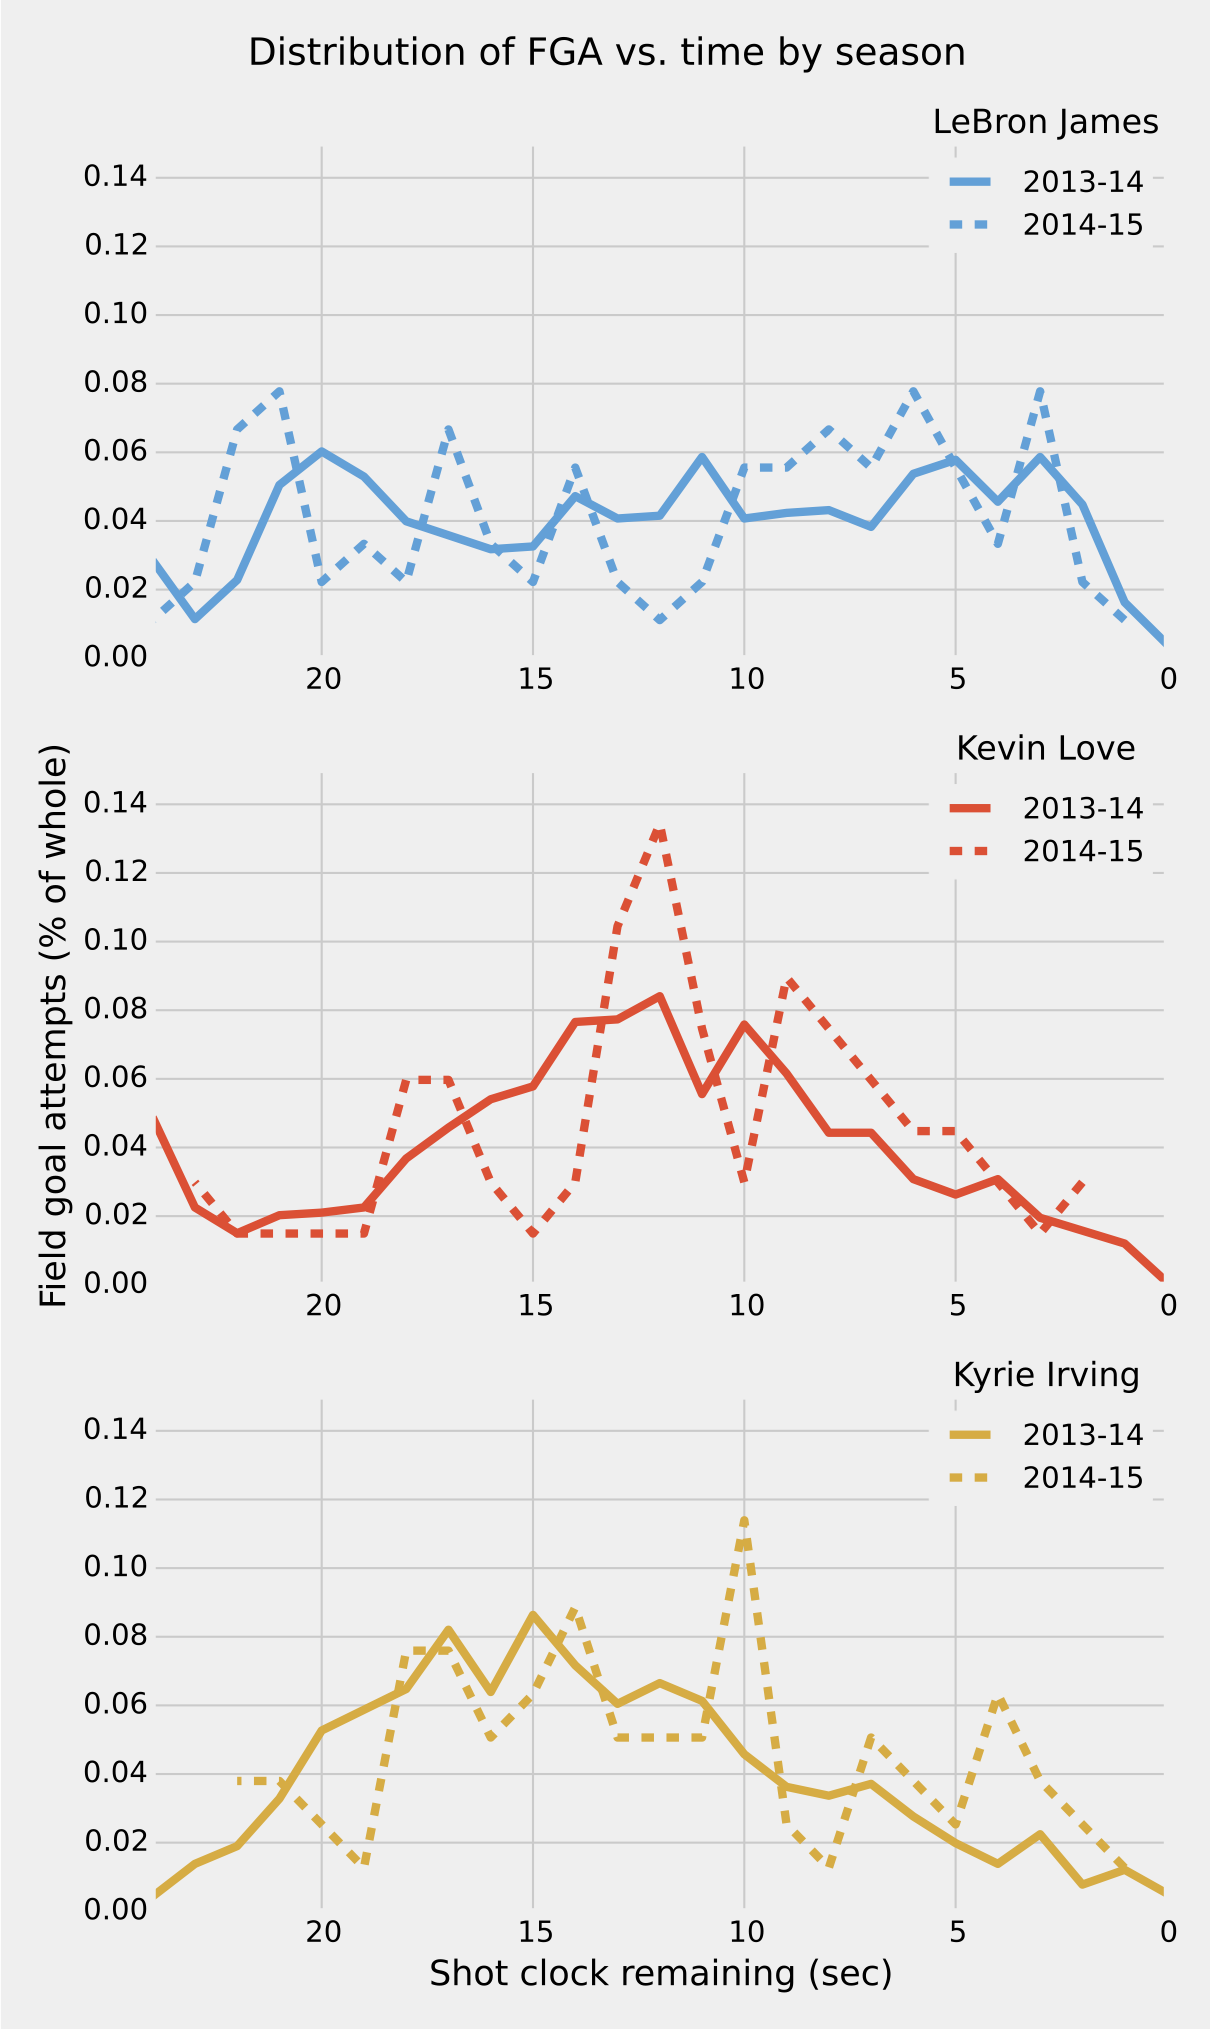
I’ll cut to the chase. I have two plots that I’ll describe briefly. The first plots the distribution of shot attempts by time for the Cleveland “Big Three” of LeBron James, Kyrie Irving, and Kevin Love, for this season (so far) and all of last season.
As you can see, LeBron’s 2013-2014 season was remarkably uniform, at least compared to Kevin Love’s and Kyrie’s seasons. A lot of this probably has to do with ball-handling, as LeBron is a huge focal point on any offense and Kevin Love is less likely to bring the ball up the floor, resulting in less shots early in the shot clock, at least in comparison to the point guard in Irving.
In fact, we may have already seen the effect that LeBron has on Kyrie’s game, at least a little bit, as Kyrie’s shot attempts have shifted to later in the shot clock, probably as a result of LeBron handling some of the ball-handling duties.
Please note that these plots don’t imply anything about the amount of shots taken by the three players, just the shot distributions.
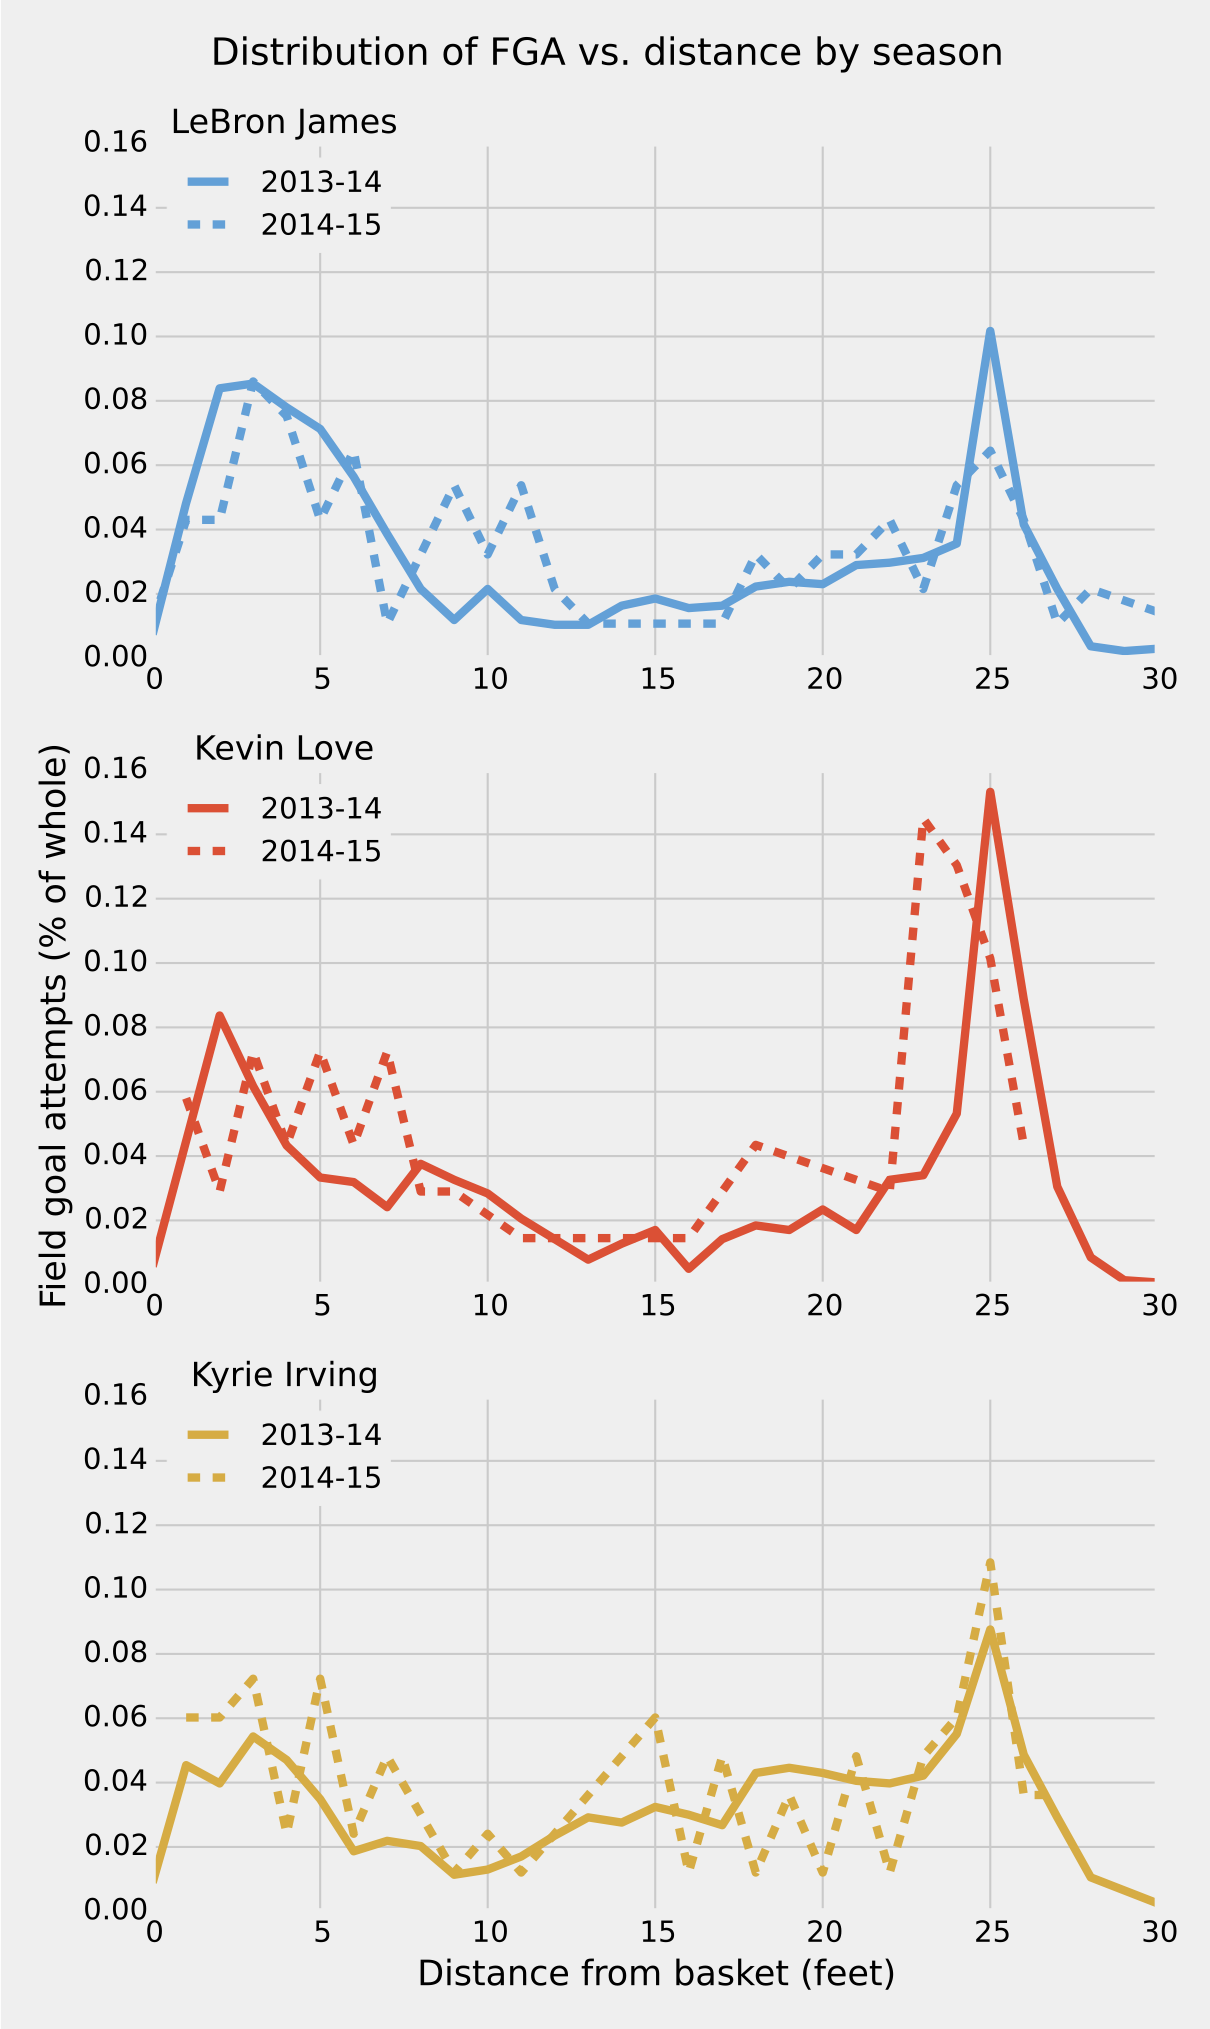
This second plot is very similar to the first, but instead looks at the shot distributions of the shot distances from the basket. LeBron in particular has eschewed the midrange game and gets to the rim most frequently of the three, whereas Kyrie and Kevin Love both are taking as many three’s as ever.
Later on, especially as we get more than 6 games into the season, I’ll take a look at incorporating the distance of the nearest defender, the time that each player holds onto the ball or dribbles, and try to see some of the characteristics of good offenses.
If you have any ideas or suggestions, let me know!